Write us to: sales@volgsol.com

Customer Satisfaction (CSAT) is the type of ratings given to the agents from the customers or requesters at the end of the ticket before setting its status to solved or closed. It shows how much a customer was happy or unhappy with the way of your consulting or problem-solving method. Administrators or editors with such privileges can create reports on this satisfaction in Explore. Here we will see how to create a report on customer satisfaction by agents in Explore step by step.
What you will need:
- Skill Level: Intermediate
- Zendesk Explore Professional or Enterprise
- Editor or administrator permissions
- Ticket data in Zendesk Support
Creating the Report:
To create a report navigate to the following steps:
1. Click the reports icon, in the Zendesk Explore.
2. In the Report Library, click the button New Report.
3. Select the dataset by clicking on Support > Support – Tickets, and then click Start Report on the Select Dataset page.
4. The Report Builder will open.
5. To add the Metrics values, click Add.
6. Select Tickets > Resolved Tickets, then click Apply in the metrics list.
7. Then also select Customer Satisfaction > % Satisfaction rated and Customer satisfaction > % Satisfaction score, then click Apply, in the metrics list.
8. In the Columns section, click Add.
9. Choose Assignee > Assignee Name, then click Apply, in the attributes list. See Managing the Custom Calculated Attributes in Explore.
10. On the Visualization Type menu, click Column.
11. Click the % Satisfaction rated, select Dual, and then click Apply.
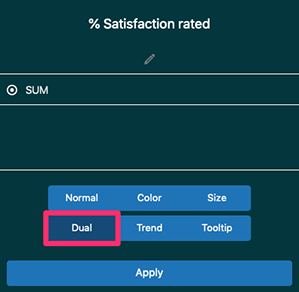
12. Click the % Satisfaction score metric, change it to Dual, and then click Apply.
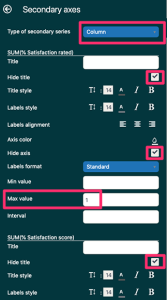
13. From the Chart Configuration, click Secondary axes.
14. Change the Type of secondary series to Column, on the Secondary axes page from the drop-down.
15. Under SUM(% satisfaction rating), set the Maximum value to 1.
16. Select Hide title under each metric, and also hide the axis under one of the metrics.
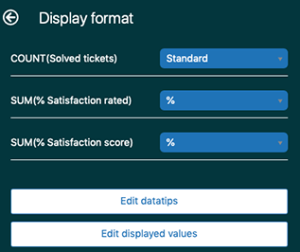
17. Click the Display Format, on the Chart Configuration menu.
18. On the Display Format page, change the display format for % Satisfaction rated and % Satisfaction score to %.
19. Click the Displayed values, from the Chart Configuration menu.
20. Change the Show value to Show, on the Displayed values page.
21. Review the report and Save it to the Dashboard. See Managing the Explore Dashboards.
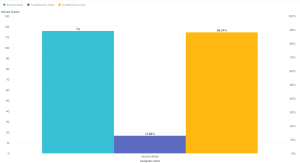
The report is complete. To check the result see the picture below.
Some more steps:
Below are some examples of how you can improve this report’s overview.
22. Add a filter for Ticket Solved – Date and then adjust the time period to the period you want information for.
23. You can use the top/bottom filter to filter top agents by ticket resolution.
24. To show results, only where the number of satisfaction surveys offered was greater than the value, you can use the metrics filter.
25. See selecting a range of metric results.
For further queries regarding Reporting on Customer Satisfaction by Agents in Explore, please leave a comment below.