Write us to: sales@volgsol.com

In Explore, the dashboard is a place to display Zendesk products’ information with the help of account editors, administrators and agents with these privileges. Dashboards let you view, share, (with Professional or Enterprise plans) create, and customize reports that give you insight into your Zendesk data.
This article walks you through the types of panels or dashboards available in the Explore app and provides some resources for more detailed information about working with panels or dashboards.
This article will cover the following topics:
- Pre-built dashboards
- Custom dashboards
Let us see these topics one by one:
Pre-built dashboards:
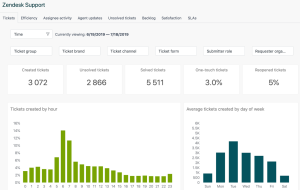
All versions of Zendesk Explore include pre-built dashboards that display your Zendesk business information in an easy-to-read format.
Here are the pre-built dashboards available in Explore by Zendesk authorities:
- Zendesk support
- Zendesk Talk
- Zendesk Guide
- Zendesk chat
- Zendesk Reply Bot
- Zendesk For Sale
- Live Panel (Explore Enterprise only)
All Explore users can view pre-built dashboards, regardless of their role. If you’ve just activated the Explore feature and don’t see the out-of-the-box dashboards, make sure your own Explore account has the Administrator role. If any of your Viewer agents cannot see the pre-created dashboards, make sure the dashboards have been shared with them.
Pre-built dashboards are read-only but Explore Professional and Enterprise users can create editable copies of them. Pre-built dashboards and the reports they contain can be useful as templates for creating new reports and dashboards.
Custom dashboards:
With the Explore Professional and Enterprise plans, you can create custom dashboards that better suit your specific reporting needs.
To create your own dashboard, you’ll need the following:
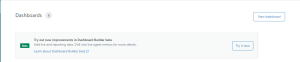
1. Create a new dashboard by clicking on the New dashboard button in Explore.
2. Add your data. After you create a dashboard, you add the data you want to see to it, including reports, filters, and other widgets. These widgets allow you to create unique dashboards and give your agents the flexibility to analyze data exactly as they need it. On whole, it includes adding and arranging dashboard widgets.
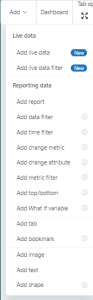
3. Customize the look and feel. When you’ve added the widgets you want, you can start customizing your dashboard. Customization options include colors, text formatting, interaction options, and more
![]()
4. Share your dashboard. When you create an Explore dashboard, only you can see it by default. In practice, you’ll want to share these dashboards with other people on your team. After you share a dashboard, the users you share it with will receive an email invitation to view it.

For further queries regarding Managing the Explore Dashboards, please leave a comment below.