Write us to: sales@volgsol.com


In this recipe, we will see how to create a report on the average first response time or first reply time in minutes for tickets or requests solved each day of the week.
What we will need:
- Skill Level: Intermediate
- Time required: 10 minutes
- Zendesk Explore Professional or Enterprise
- Editor or administrator permissions
- Ticket data in Zendesk Support
Creating the first reply time report in Explore:
1. Click the reports icon in the Explore section.

2. In the Report Library, click New Report.
3. On the Select Dataset page, select the Support > Support – Tickets dataset and then click Start Report. The new Report Builder will open.
4. In the Metrics section, click Add.
5. In the metrics section, select Duration Between Events – Calendar Hours (min) > First Response Time (min), then click Apply.
6. Click on the metric you just added, select AVG as the aggregator for that metric, and click Apply.
7. In the Rows section, click Add to add the attributes.
8. Choose Assignee > Assignee Name from the list of attributes, then click Apply.
9. In the Filters section, click Add.
10. Select Time – Ticket solved > Ticket solved – Week of Year from the list of attributes, then click Apply.
11. Click the filter you just added, then click Edit date ranges.
12. On the Date range page, select Last Week and then click Apply.
13. This report looks at the date the ticket was solved, but you can use any other date event, also.
14. When all the reporting is done, Save the report to Dashboard. See Managing the Explore Dashboards.
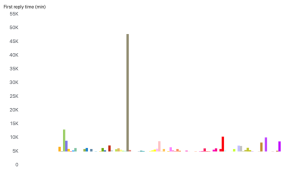
To something that better suits your data, you can also change the chart type. A Bar Graph will be suitable for such a report.
For further queries regarding Reporting on First Reply Time in Explore, please leave a comment below.