Write us to: sales@volgsol.com


A forecast determines how much your company plans to sell within specific time duration. For this, we can do two types of forecasting which are as follows.
- Opportunity Quantity: The number of chances the organization has designated to close and the amount they have closed .
- Opportunity Amount: How much sum is planned on and how much is spent after selling.
A faultless sales forecast will help the company to understand what is working and what is not.
Forecast Category and Opportunity Stage relationship
There are different opportunity phases. In any case, at the high level, it is close and open. There are more phases at the open stage.
Probability: It expanded based on phase. Open opportunity can be of any phase-like capability. In any case, the more we progress, the more probability increases. For example, customer interest in the product increases with each phase.
Forecast Category: There are different categories which are as follows;
- Pipeline: It means that the customer is in the early phases of the buying procedure.
- Best Case: It means that there is work to do to enhance these opportunities.
- Commit: The Close Plan is going very well basis on these opportunities.
- Closed: These opportunities won. No more sales effort is required to set the seal on the deal.
- Omitted: When they are Lost or qualified out.
Modifying Standard Forecast Categories
We can modify the class and probability for every phase based on the business use case.
Forecast Category is not around a single opportunity of the opportunities is in that period. For example, it will bring every one of the opportunities for that period.
How about we comprehend with the assistance of model:
What is the opportunity amount beneath the pipeline?
It is opp1 + opp2 + opp4 = 30000
What is the opportunity amount beneath Best Case?
It is opp3 + opp3 = 20000
What is the opportunity amount beneath Commit?
It is opp5 + opp6 = 20000
What is the opportunity amount beneath Closed?
It is opp7 + opp8= 20000
Opp4 is pipeline just as in the best case in some quarters. So for this situation, assuming we do not utilize figure class, we will not have the option to isolate it will resemble a copy record.
The forecast category assists with comprehension. In case the phase is changed. However, it is under the same quarter.
Let’s Enable Forecasts in Salesforce Org
From Setup, enter Forecasts Settings in the Quick Find box and select Forecasts Settings.
Add a Forecasts Tab
In the Quick Find box->enter App Manager ->Select App Manager-> click the Edit quick action for Lightning app->Move Forecasts from the accessible column to the Selected column, and then save changes.
From the Tab Settings dropdown list, select Default On, and then save your changes.
Forecast Types
Go to setup-> search for Forecast types in quick find- > Create Forecast Type
Forecast based on which object:
• Opportunity: Based on Amount.
• Opportunity Product: It is using for product family paring.
• Opportunity Split
Opportunity Split in more detail:
Many people can be working on a single opportunity who are internal users/salespersons called opportunity group. Now by dividing the opportunity amount among several people working on that opportunity is opportunity split. It is splitting the percentage.
So now, we will select opportunity entity and click next. Forecasting by either amount or quantity. The below image depicts that forecast will run based on the closed date of opportunity. It can be another field as well.

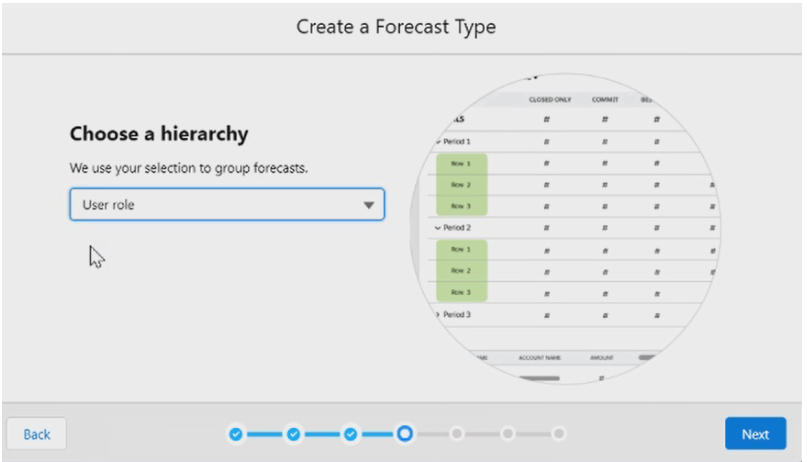
By User Role – Role hierarchy
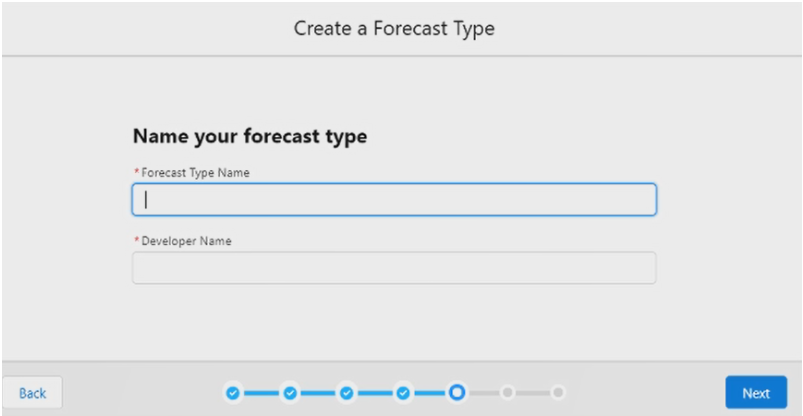
Assigning name Forecast type
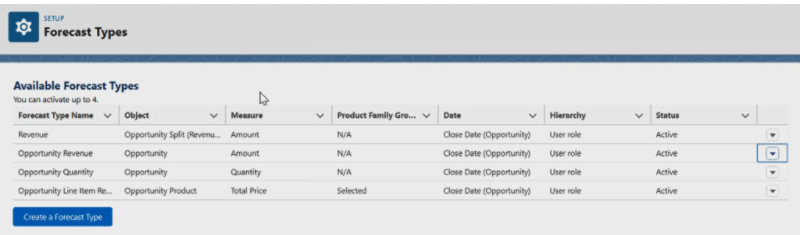
Once you create Forecast type, it will show in the list
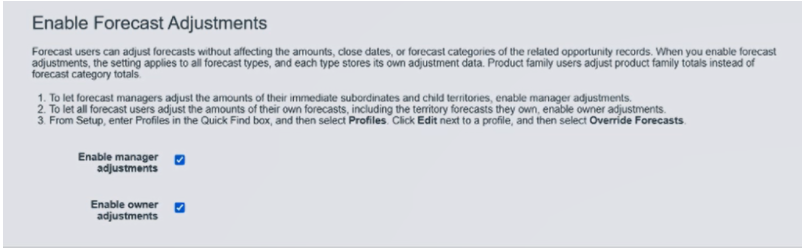
Forecast Settings:
Few opportunities have no caught in Customer Resource Management. The worth will not come here. Assume there is a crusade-held bargain that got broken there itself and could not detect in CRM. Presently suppose- $800 broken if the manager has that checkbox empowered, the manager can change the sum manually.
To modify values later by the manager, we will select ‘Enable Manager Adjustment’
To modify values later by the owner, we will select ‘Enable Owner Adjustment’
Now we will find which opportunity manipulated and which is not?
Forecast Rollup
This topic becomes a little confusing so let’s understand.
Single forecast category
The opportunities from each forecast category into separate forecasts for each is called single forecast category.
Example: Opportunity proceeds from Pipeline to Commit category in the same quarter.
Individual forecast category: It will show the Current opportunity only that is in the current classification.
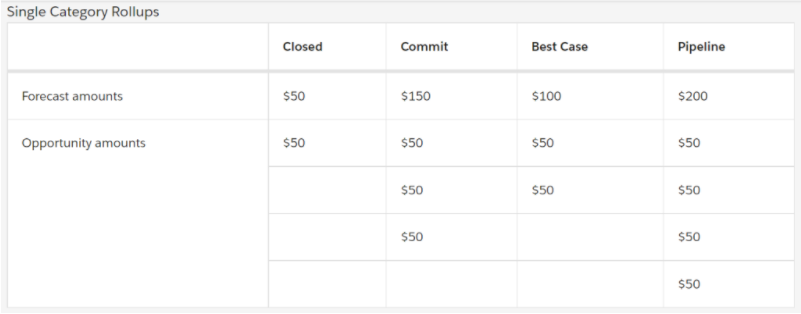
In Single Category rollup, we only add up the opportunity amount of category i.e.
Closed = $50 because opportunity quantity is $50 in this category.
Commit = $50 + $50 $50 = $150
A similar thing goes for more categories. It will show apart forecast for every type. A similar thing goes for more categories. It will show apart forecast for every category.
Cumulative forecast: Opportunities from multiple forecast categories is cumulative. Let’s focus on below
- Closed Forecast will show closed opportunity only i.e. $ forecast)50.
- Commit Forecast = Commit + Closed i.e. Commit: $50 + $50 + $50 = $150
Commit + closed: $50 + $150 = 200
- Best Case Forecast: Best Case + Commit + Closed i.e. 100+ 150 + 50 = $300
- Pipeline Forecast: Pipeline + Best Case + Commit i.e. 200 + 100 + 150 = $450
I hope you can understand.
Set a Default Forecast Date Range
The forecasting page shows figures for individual months or quarters and a scope of months or quarters, depending upon the settings you pick.
Enable Forecast Users
We can enable forecast clients on the All Users page or the Forecasts Hierarchy page.
Setup->Enter Users-> Select Allow Forecasting
Forecast Hierarchy
You can also add users to the forecast hierarchy
Forecast Quotas
A quota is a monthly or quarterly sales target to a client or territory. A manager is quota equivalents the deals that the administrator and group are relied upon to create together.
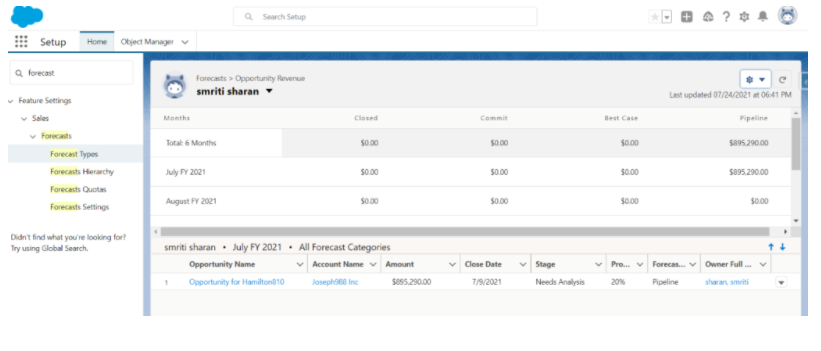
Output
When I view my forecast tab, forecast data will automatically occupy with my related opportunities.