Write us to: sales@volgsol.com

In this discussion, you’ll learn how to create a journey overview to analyze, assess or study a deal’s progress through the sales funnel. This will help you know how many deals are coming in, how many are in contract negotiation, for company’s record keeping purpose and so on. Let us see how to create funnel report that shows deals in sales pipeline.
What you will need?
You will need these items to create the above-mentioned report.
- Zendesk Explore Professional or Enterprise
- Editor or administrator permissions
- Sales data in Zendesk Sell
- Skill Level: Beginner
- Time required: 5 minutes
How to create funnel report on deals?
Navigate to the following steps to perform this reporting.
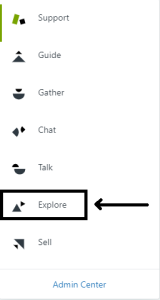
1. In the Explore section, as below:
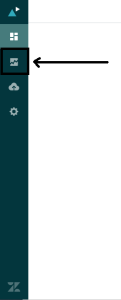
2. Click the Reports icon.
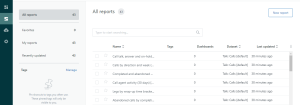
3. Click on New Report button, in the Report Library.
4. Now you are on the Select Dataset page, click Sell then Sell – Sales, and then click Start Report. The Report Builder or schema will open.
5. Click on the Add button, in the Metrics panel.
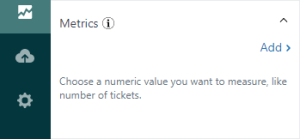
6. Select Deals from the list and then click Apply.
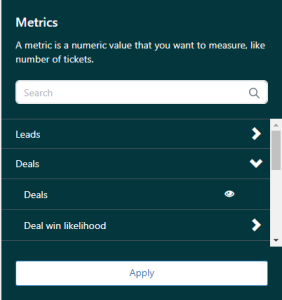
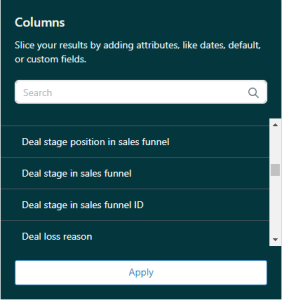
7. Select the following attributes from the Columns panel, and then click Apply.
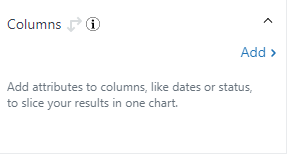
- Deal stage position in sales funnel
- Deal stage in sales funnel
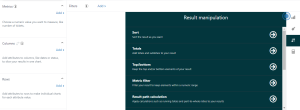
8. From the Result Manipulation menu, select Result path calculation and fill in the following fields:
- Pattern: Running total
- Path: On columns
- Aggregation: SUM
- Starting point: Last element
9. Click Apply.
10. Select Funnel type from the Visualization Type menu.
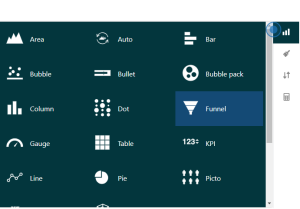
You will see you report in such form as shown below:
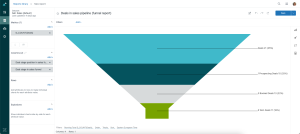
Note: Sell users who have a Suite Professional plan or higher can also create this type
of report in Zendesk Explore.
That was the detailed overview that how to create funnel report for deals in sales pipelines. For further queries regarding the Deals in Sales Pipeline (Funnel Report) in Zendesk Explore, please leave a comment below.


